



Construction Equipment Analytics Software for Fleet Reporting
Clue is an equipment analytics platform for utilization, hours, repair costs, inspections, fuel, and fleet financials. Build, schedule, and share reports.







Reports and analytics
One reporting workflow. From hours to leadership review.
Review Utilization and Reconcile Equipment Hours
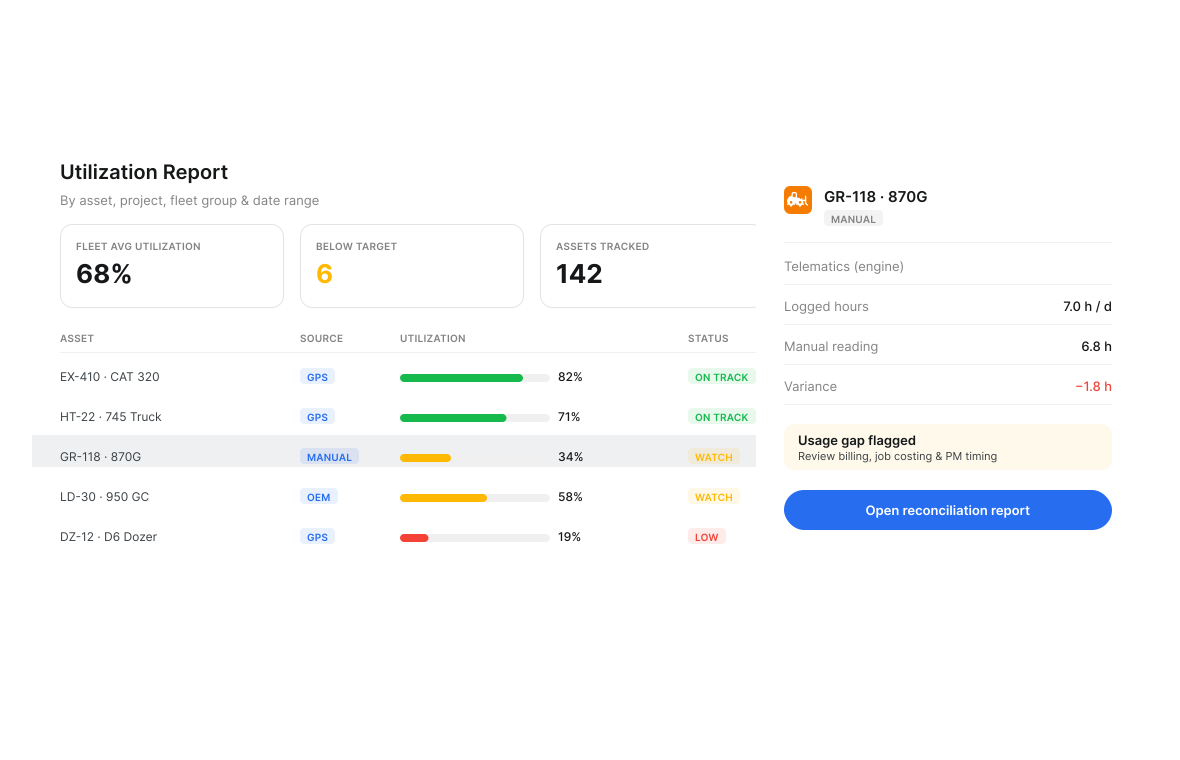
Hours Reconciliation compares telematics hours with logged hours, so teams can catch gaps before billing disputes. The Utilization Report shows engine hours, odometer, fuel rate, and daily use against each asset's target.
Utilization Report: Review equipment usage by asset, project, fleet group, date range, or available reporting field
Hours Reconciliation: Compare telematics activity against logged or reported hours
Idle and operating hours: Review idle hours, idle rate, operating hours, and utilization rate for each asset
Underutilized asset review: Surface equipment with usage below target
Utilization targets: Compare usage against configured targets by asset or asset class

Fleet Financials, Rental Costs, and Charge Rates
Fleet Financials shows revenue, cost, and profitability by asset, fleet, or project. The Rental Report tracks rental activity and cost. The Rate Module sets project charge rates by asset type, equipment class, or single asset.
Fleet Financials Dashboard: Review revenue, cost, profitability, and utilization by asset, fleet, project, or available reporting field
Not Profitable cards: Show each asset running a negative margin
Rental Report: Review rental activity, cost, status, and reporting-period data
Rate Module context: Compare charge rates by asset type, equipment class, individual asset, or project

Track Inspection Reports, Missed Checks, and Open Issues
The Inspection Calendar shows scheduled, completed, and missed inspections across the fleet. Summary tiles track completion, open equipment issues, and crews that finish inspections on time.
Inspection Calendar: Review scheduled, completed, and missed inspection activity by day
Completion metrics: Track required inspections, completed inspections, completion rate, and issues found
Issue drill-down: Review which assets were missed, who completed each inspection, and what issues were reported
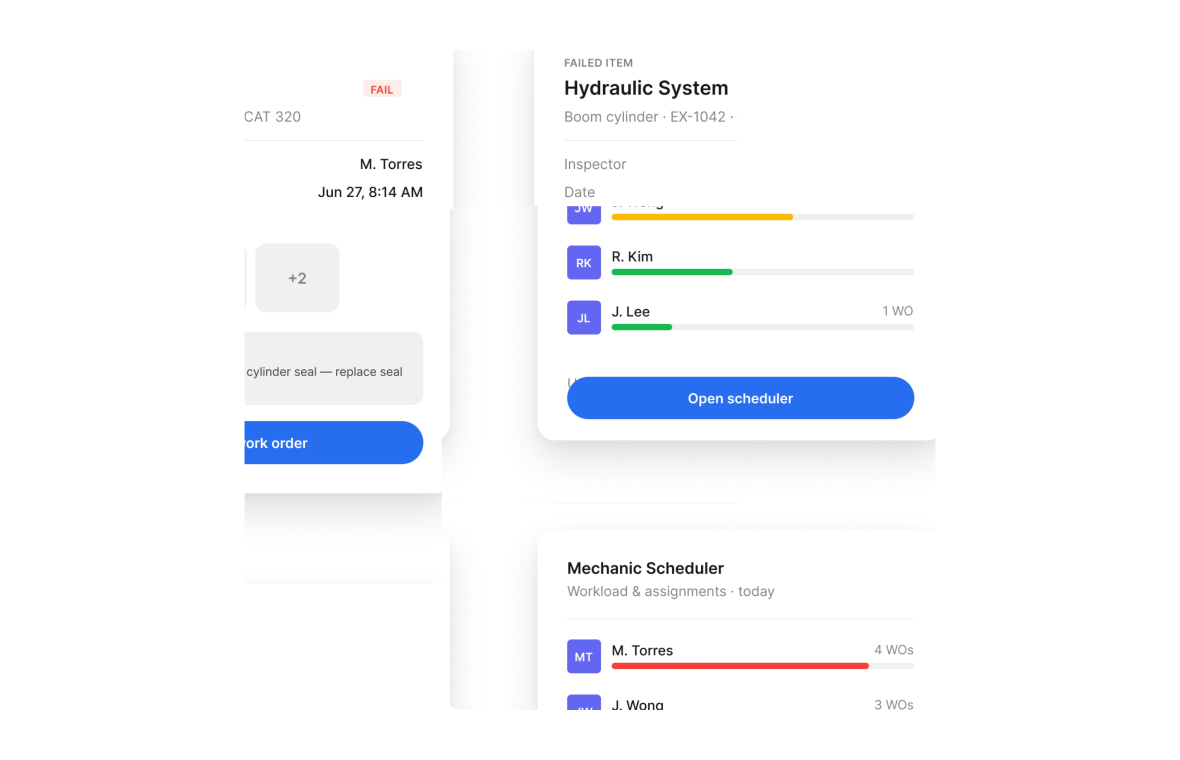
Open issue review: Track failed inspection items that need repair follow-up
PDF reports: Export completed inspection reports with attached evidence for documentation or audit review

Review Fuel Use, Idle Activity, and Emissions Signals
The Fuel Report shows fuel rate, volume, and cost for each asset by project and date. Connected equipment data adds idle activity and estimated emissions.
Fuel Report: Review fuel activity by asset, project, date, or reporting period
Asset Utilization Report: Review fuel used, fuel efficiency, idle hours, and utilization metrics together
Idle fuel review: Review fuel used in idle when your connected telematics source sends it
Project fuel activity: Assign fuel entries to the right project and date for more accurate reporting
Estimated CO2 emissions: Review carbon emissions calculated from fuel consumption for sustainability reporting

Review Work Order Status and Maintenance Progress
The Mechanic Scheduler shows each mechanic's daily workload, color-coded status, and unassigned work. The PM dashboard tracks Good Standing, Upcoming, and Overdue work. Mechanics log time in each work order.
Work order status view: Review open, assigned, in-progress, and completed work orders across available filters
Calendar Scheduling: Review scheduled work orders by day, week, month, or quarter
Mechanic Scheduler: Review mechanic workload, unassigned work orders, status context, and repair assignments
PM status review: Review Good Standing, Upcoming, and Overdue PM status before assigning scheduled work
Work order time tracking: Review total time on work orders from linked timecard hours

Build and Schedule Reports for Leadership Review
Clue's equipment management reporting software saves views, builds reports from plain-language requests, and emails them daily, weekly, or monthly. Fleet Financials adds summaries for operations, finance, and leadership.
AI Report Builder: Create custom reports from plain-language requests instead of rebuilding spreadsheets
Scheduled Report Delivery: Send recurring reports to selected recipients on a daily, weekly, or monthly cadence
Saved report views: Keep useful reporting views available for repeated review
Filtered performance views: Review data by project, asset type, division, region, date range, or available reporting field
Shareable reports: Export or share reporting outputs for operations, finance, project, or leadership review
Built for every role
Solutions for every team.
Field, shop, and office teams use the same system. Equipment managers, fleet managers, operations leaders, CFOs, and executives see equipment details for their work.

Equipment Manager
“It's a single pane of glass where you see everything across your fleet, from the field to the phone to the computer.”
Abe Sharaf
Equipment Manager, Pulice Construction
Read Pulice’s story

Fleet Manager
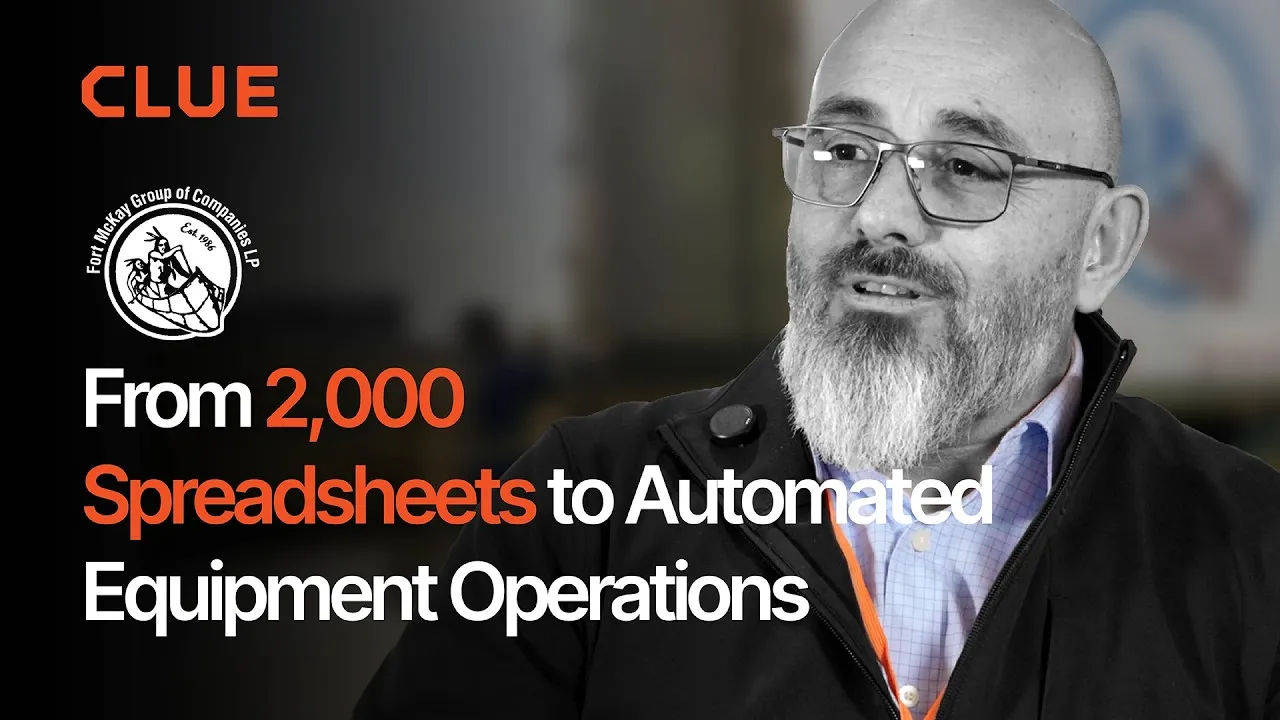
“Imagine receiving 2,000 spreadsheets that needed to be approved individually in an email. There were entire teams dedicated to that. Now the system is fully automated, completely automated from beginning to end.”
Julio Lopez
Fleet Manager, Fort McKay Group
Read Fort McKay’s story

CFO
“You went from doing two services a day to six services a day. That right there is priceless to me.”
Darrin Sheriff
Director of Maintenance & Purchasing, Palmetto Corp
Read Palmetto’s story

VP of Operations
“The big thing with Clue is that we're able to bridge the gap between our field, our operators in our shop, and other departments. Everybody's bought into Clue now.”
Eric Sellman
COO, Brent Scarbrough & Co
Read Brent Scarbrough’s story

Executive
“We had 20 different logins between all our different softwares and web platforms. Now all that information pulls into one spot and we're able to see it in a single place.”
John Igel
CEO, George Igel Co.
Read Igel’s story

Operations Manager
“The operator's in control of his own destiny. That was a huge reason why not only did I buy into it, but I'm also investing into it for the future.”
Ben Benoit
Operations Manager, Onshore Companies
Read Onshore’s story
Across the reporting week
Why Construction Companies Report on Equipment in Clue
Clue's construction equipment analytics software lets operations, shop, finance, and leadership teams report from the same fleet data their crews already log.
Faster Recurring Reviews
Save report views and schedule delivery so weekly and monthly fleet reviews start with the numbers already organized.
Hour Checks Before Billing
Hours Reconciliation compares telematics hours with logged hours, so teams can catch gaps before billing disputes.
Better Asset Financial Review
Connect Fleet Financials, utilization, rental activity, and rate context so teams can review how each asset contributes to fleet performance.
Clearer Maintenance Follow-Up
Clue brings work order status, PM timing, labor time, and repair progress into one review.
More Useful Inspection Records
Track completed checks, missed inspections, reported issues, evidence, and PDF reports from the same inspection workflow.
Custom Reports in Plain Language
AI Report Builder creates the query from your plain-language report request.
Equipment Data Stays With the Report.
Clue brings data from 80+ integrations into the same reports, including OEM telematics, GPS, aftermarket trackers, ERP, accounting, and CMMS systems. Teams can add equipment by hand to those reports.














.png)






From the people who use it every day
What contractors say
“There were entire teams dedicated to approving spreadsheets one by one.”
Fort McKay First Nation
“The big thing with Clue is that we’re able to bridge the gap between our field, our operators in our shop, and other departments.”
Brent Scarbrough & Company
“The biggest difference has been the user friendliness.”
William A. Hazel
“It exposes dead cost or overhead that maybe we don’t know about because it gets lost in those three different systems.”
Moss Utilities
“Clue’s real-time data capability has completely changed the way we manage our assets.”
Darrin Sheriff, Director of Maintenance and Purchasing
“It was probably taking the better part of a day to combine all the data from the telematics.”
Derek Wolfe, Equipment Manager, George Igel Co.
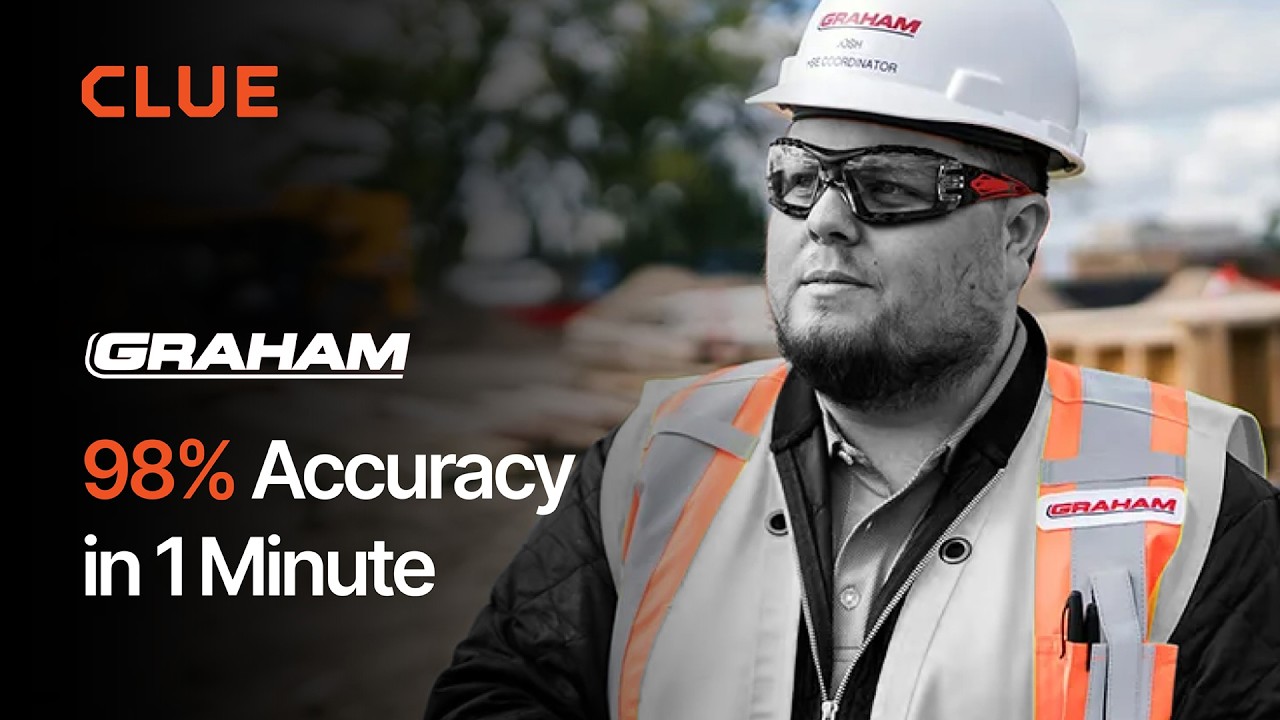
“Clue allows us to effectively control our operations: financially, effectively and safely.”
Joseph Yammine, Project Manager, Graham
“QR codes have been a game changer for us with regards to operator inspections.”
Ben Benoit, Operations Manager
“It’s a single pane of glass where you see everything across your fleet, from the field to the phone to the computer.”
Abe Sharaf, Corporate Equipment Engineer
“Our field guys were tired of having a new product, a new something to learn each time.”
Rob Judge, Sr. Procurement & Program Manager
“Our equipment is in far better shape since we started using Clue, for sure.”
Jake Farley, Equipment Manager, Silver Star Construction














Asset Directory in Clue: Saved Views, Bulk Edits & Meters
Parts Management in Clue: Requests, Delivery Tracking & Inventory
Template Manager in Clue: Inspection Templates, AI Import & Shared Categories
Preventive Maintenance in Clue: Build a PM Plan, Automate Work Orders
Work Orders in Clue: Repair History, Parts, and Labor Costs
Common questions
Construction equipment analytics software FAQ.
What is construction equipment analytics software?
Construction equipment analytics software turns fleet data into reports on equipment use, maintenance, fuel, inspections, work orders, and costs. Clue brings construction fleet analytics into one platform, where teams can review asset performance through the filters that fit each report.
What types of reports does Clue support?
Clue supports utilization reporting, Hours Reconciliation, Fuel Report, Inspection Calendar reporting, work order status reporting, preventive maintenance status review, Fleet Financials, Rental Report, custom reports, and scheduled report delivery. These reports help operations, shop, finance, and leadership teams review equipment performance from different angles.
How does Clue collect reporting data?
Clue reporting can use connected telematics, OEM integrations, GPS data, mobile inspections, fuel entries, work orders, PM records, rental records, timecards, parts activity, and asset records. The exact reporting output depends on the data sources connected and the workflows used by the team.
Can Clue track equipment utilization across multiple projects?
Yes. Clue helps teams review utilization by asset, fleet, project, reporting period, and available filters. Teams can compare equipment activity, idle time, operating hours, and utilization targets to understand how assets are being used across active work.
What is Hours Reconciliation in Clue?
Hours Reconciliation helps teams compare telematics hours against logged or reported hours. This gives fleet and finance teams a better way to review usage gaps before utilization, billing, job costing, maintenance timing, or internal cost review depends on that data.
Can Clue schedule automatic report delivery?
Yes. Clue supports Scheduled Report Delivery so reports can be sent to selected recipients on a daily, weekly, or monthly cadence. This is useful for recurring fleet reviews, utilization updates, financial reviews, maintenance summaries, and leadership reporting.
What AI reporting features does Clue have?
Clue includes AI Report Builder, which lets users describe the report they need in plain language. Clue builds the query without requiring SQL or an IT ticket, helping teams create custom reports from the fields and filters available in their account.
Can Clue report on fuel use and emissions?
Yes. Clue supports fuel reporting by asset and reporting period, including fuel volume, rate, and cost. Clue can also support estimated carbon emissions calculated from fuel consumption for sustainability reporting when the required fuel data is available.
Can Clue report on inspections and missed checks?
Yes. Clue’s Inspection Calendar helps teams review scheduled, completed, and missed inspections in a calendar format. Teams can review completion rate, required inspections, completed inspections, issues found, missed assets, and inspection records tied to the asset.
Can Clue report on work orders and maintenance progress?
Yes. Clue shows work order dates and status on the work order list. The Mechanic Scheduler shows each mechanic's workload. The PM view groups equipment as Good Standing, Upcoming, or Overdue. Mechanics log labor time in each work order.
Can Clue support fleet financials and equipment cost analysis?
Yes. Clue Fleet Financials helps teams review revenue, cost, profitability, and utilization by asset, fleet, and project. Clue also supports Rate Module workflows, Rental Report data, and cost-related reporting that helps finance and operations review equipment performance together.
Can Clue reporting connect with ERP or financial workflows?
Yes. Clue supports ERP and accounting integrations for workflows such as work order data, timecard records, cost codes, equipment cost activity, and related financial review. This helps teams reduce duplicate entry and keep reporting closer to the systems used for job costing and accounting.
Can I report on equipment without a GPS tracker?
Yes. Equipment entered by hand appears in the same reports, with hours, costs and inspection records added by the team.
How much does Clue reporting cost?
Clue bases your personalized plan on your equipment, crew, and job needs. The pricing page has a short form. Our team follows up to review your needs and walk you through your tailored plan.
See Clue pricingWhat does setup involve?
Setup starts with your asset list, your projects and your connected data sources. A Clue analyst works through them with your team, so your first reports run on your own data.
What does an equipment analytics platform do?
An equipment analytics platform pulls utilization, hours, fuel, inspections, work orders, and costs into one set of reports. Clue connects telematics and equipment records through 80+ integrations. Teams filter reports by project, asset type, or date range. They can schedule reports for email delivery.
How does Clue reporting compare with spreadsheets or Excel?
Compared with a spreadsheet, Clue builds each report from the same connected fleet data. Engine hours and odometer readings sync from connected telematics. The AI Report Builder turns a plain-language request into a report. Scheduled delivery emails reports daily, weekly, or monthly.
Can I pull Clue data into a BI tool or dashboard?
Yes, Clue's external API can feed a BI tool or custom dashboard. It returns historical daily utilization data, plus equipment records, location status, and work order parts. Customers use the data to build their own dashboards. Webhooks send real-time events to connected systems.
Can each role see the reports it needs?
Yes, Clue uses role-based access so each person sees the reports and tools for their work. Roles include Admin, Manager, Mechanic, Operator, Driver, and Fueler. Teams can also send scheduled reports to any email address, so the right people receive each update.